Why play beats prose
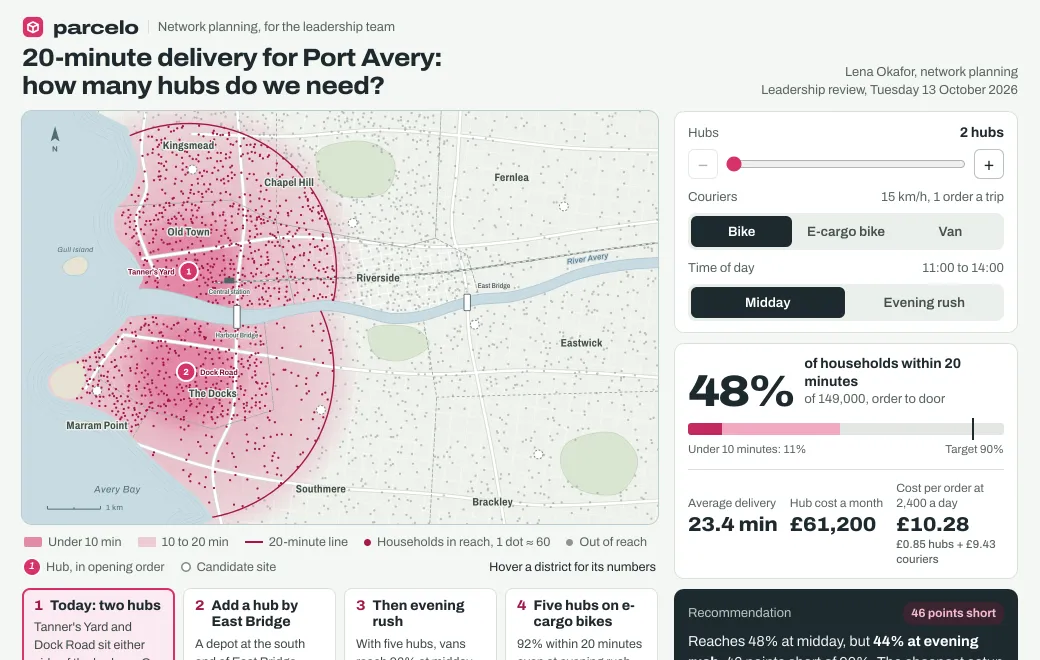
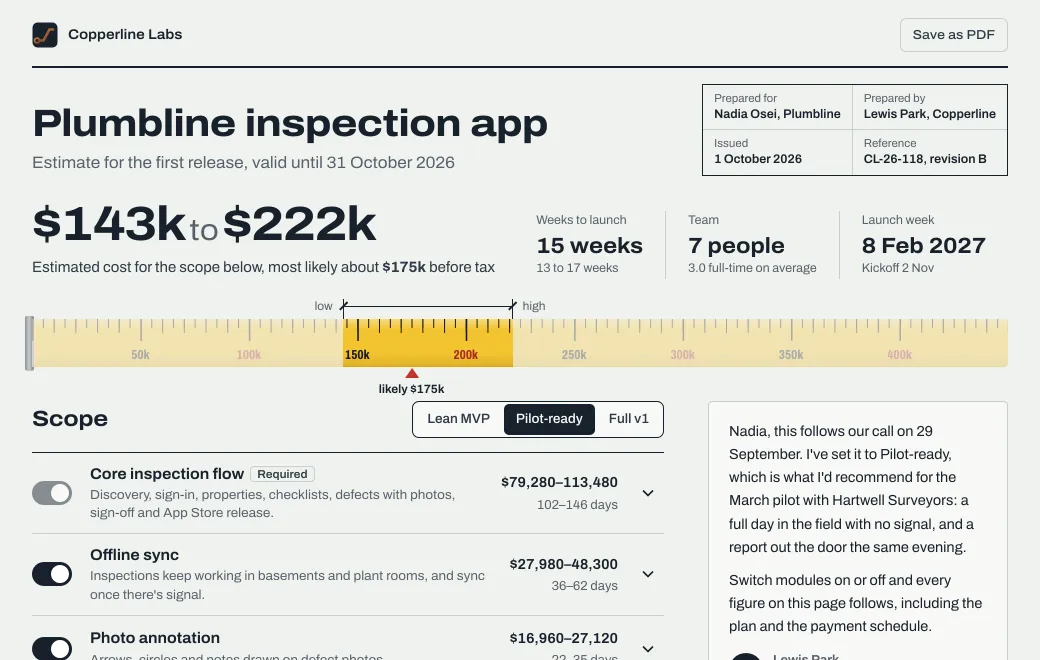
Tell people “six hubs get us to 20-minute delivery” and they have to take your word for it. A map where they add the hubs and switch to evening rush lets them check it for themselves.
The Parcelo map above opens with four story steps and then hands the controls to the reader. Its recommendation updates with whatever they try, so everyone starts the meeting from the same picture.
Shapes that work
| The idea | Show it as |
|---|---|
| Where to open, expand or cover | A map with coverage you can change |
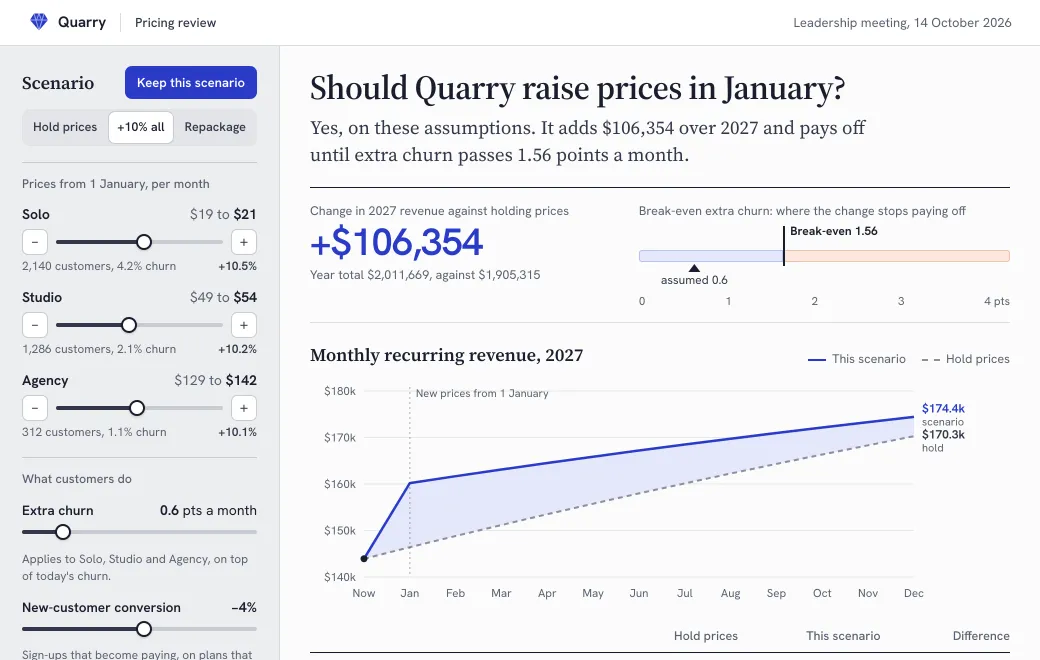
| How a change ripples through the business | A model with a few inputs and a chart |
| A new process | A flow you step through, with what changes at each step |
| A market or a portfolio | A positioning chart with filters |
| A system or an architecture | A diagram you can click into, or Mermaid in Markdown |
How to make one
- Write the point first
Start with the one sentence the reader should end up believing. Everything on the page should serve it.
- Pick two or three controls
Choose the levers that change the answer most. Any more and it turns into a toy; any fewer and it’s just a chart.
- Ask your agent to build it
Give it the numbers and the model in plain words, and ask for a short story mode that sets the controls step by step.
- Share it before the meeting
Keep it Private to your team workspace, or invite the people you’re pitching by email.
Keep it current
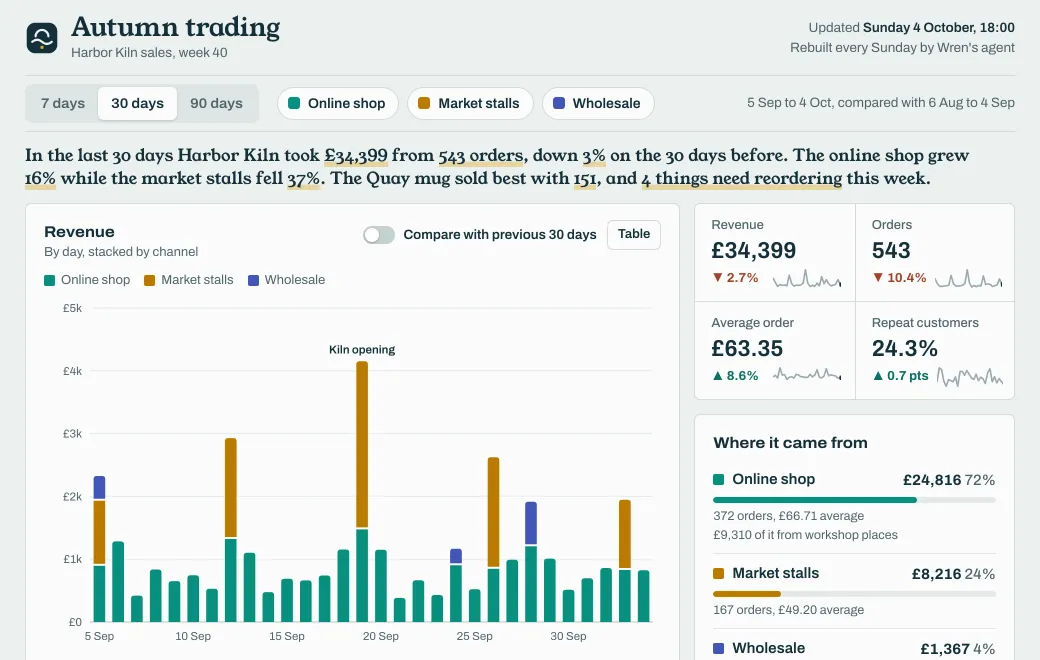
When the numbers change, the agent updates the model and the link stays the same. Anyone who bookmarked it sees the latest, and the Versions list shows how the argument evolved.
Limits
- The page calculates in the browser; it can’t query your live systems unless an API allows it from any website.
- Charts and maps are drawn by the page itself. Libraries loaded from a public CDN work too.